甘特图如何革新项目规划-How Gantt Charts Positively Transform Project Planning
When consultants, project leads or team members build presentations, one question often underlies everything: can the plan be trusted? This is how Gantt charts can positively transform project planning. Gantt charts earn trust by turning ambiguity into visible structure.
当顾问、项目负责人或团队成员制作演示文稿时,一个问题往往贯穿始终:这个计划可信吗?甘特图正是在这方面能够有效地改变项目规划。它通过将模糊性转化为清晰的结构来赢得信任。
When tasks, timeframes and dependencies are clearly laid out, stakeholders see what must happen, when it must happen, and what risks lie ahead.
当任务、时间安排和依赖关系明确列出时,利益相关者就能清楚地看到必须做什么、何时做以及未来存在的风险。
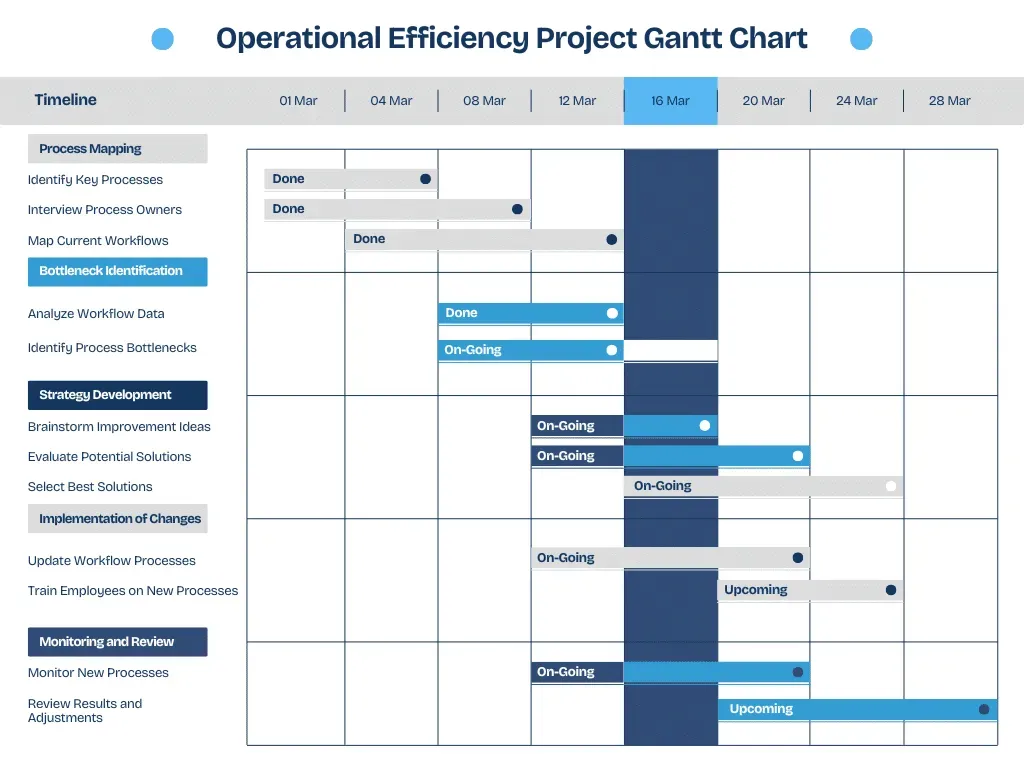
A Gantt chart plots tasks along a timeline so that each task occupies a bar from its planned start date to its finish. Dependencies among tasks become visible: you can see what must start only after something else finishes. Progress, when captured as part of the chart, shows how far work has proceeded. Milestones mark visible checkpoints. All of these elements help teams move from hopes and good intentions into measurable reality.
甘特图将任务沿着时间线绘制出来,每个任务占据一个条形,从计划开始日期到完成日期。任务之间的依赖关系一目了然:您可以清楚地看到哪些任务必须在其他任务完成后才能开始。进度(记录在图表中)显示了工作的进展情况。里程碑则标记了清晰可见的检查点。所有这些要素都有助于团队将愿景和美好愿望转化为可衡量的现实。
When Gantt Charts Add Real Value甘特图何时能创造真正的价值
Section titled “When Gantt Charts Add Real Value甘特图何时能创造真正的价值”In many industries, from software to construction, from event planning to marketing, Gantt charts support both planning and communication. For a construction project it is usual to map out phases such as site preparation, foundation, structure, finishing. In software development projects where multiple modules like frontend, backend, integration, testing run partly in parallel and partly in sequence, Gantt charts help uncover conflicts early so delays do not cascade. Marketing campaigns often depend on creative development, review, media placements, campaign launch and performance measurement; when these tasks overlap or depend on approvals, Gantt charts offer clarity.
从软件开发到建筑施工,从活动策划到市场营销,甘特图在许多行业中都发挥着重要的规划和沟通作用。例如,在建筑项目中,通常会绘制出场地准备、地基、主体结构和装修等阶段的流程图。在软件开发项目中,前端、后端、集成和测试等多个模块可能部分并行运行,部分顺序运行,甘特图有助于及早发现冲突,避免延误蔓延。市场营销活动通常涉及创意开发、审核、媒体投放、活动启动和效果评估等环节;当这些任务相互重叠或需要审批时,甘特图能够提供清晰的流程概览。
In a case shared by Gleek, an event management firm used Gantt charts not just to map logistics but also to coordinate vendors, venue compliance, speaker approvals, and local marketing. The tool functioned as both plan and diagnostic. This allowed the team to identify overlap, flag bottlenecks, and adjust deliverables before issues escalated. The Gantt chart became more than a planning tool—it served as a diagnostic framework that helped the team maintain momentum and keep stakeholders aligned across departments and time zones.
Gleek 分享的一个案例中,一家活动管理公司不仅使用甘特图来规划物流,还用它来协调供应商、场地合规、演讲嘉宾审批和本地市场营销。该工具兼具计划和诊断功能。这使得团队能够识别重叠环节、标记瓶颈并调整交付成果,避免问题升级。甘特图不再仅仅是一个计划工具,它更是一个诊断框架,帮助团队保持工作动力,并确保不同部门和时区的利益相关者步调一致。
Another example comes from infrastructure projects in East Africa. In an empirical study on public sector projects, researchers found that using visual timelines improved coordination between agencies, uncovered conflicting schedules earlier, and enabled teams to map budget needs more accurately to project phases. For large initiatives with overlapping stakeholders and long planning cycles, this clarity significantly reduced delays and resource waste.
东非的基础设施项目也是一个很好的例子。一项针对公共部门项目的实证研究发现,使用可视化时间轴可以改善各机构间的协调,更早地发现进度冲突,并使团队能够更准确地将预算需求与项目阶段相匹配。对于涉及多个利益相关方且规划周期较长的大型项目而言,这种清晰的规划显著减少了延误和资源浪费。
Common Challenges and What to Watch Out For常见挑战及注意事项
Section titled “Common Challenges and What to Watch Out For常见挑战及注意事项”Gantt charts require estimates. If your estimates are poor or overly optimistic then the chart is misleading. It is tempting to break tasks into extremely fine granularity, but that often produces a chart that is large, difficult to adjust, and hard for stakeholders to digest.
甘特图需要估算。如果估算不准确或过于乐观,图表就会产生误导。虽然将任务细化到极致看似诱人,但这通常会导致图表庞大、难以调整,且利益相关者难以理解。
Flexibility is another concern. If your environment has a lot of uncertainty or frequent changes then rigid timelines and dependencies may mislead rather than inform. Updating the chart becomes critical. Without regular maintenance the chart becomes stale.
灵活性是另一个需要考虑的因素。如果您的环境充满不确定性或变化频繁,那么僵化的时间表和依赖关系可能会误导而非提供信息。更新图表至关重要。如果没有定期维护,图表就会过时。
Finally, detail overload can confuse. Stakeholders, especially at senior levels, often do not need every task in view. They need milestones, key dependencies, and awareness of major risks. Presenting too much detail can obscure what matters instead of illuminating it.
最后,细节过多反而会造成混乱。利益相关者,尤其是高层管理人员,通常不需要了解所有任务。他们需要的是里程碑、关键依赖关系以及对重大风险的认知。呈现过多细节非但不能阐明重点,反而会掩盖重点。
How to Make a Gantt Chart Effective如何制作有效的甘特图
Section titled “How to Make a Gantt Chart Effective如何制作有效的甘特图”A Gantt chart is only useful if it’s built and used the right way, here’s how to make it work.
甘特图只有以正确的方式构建和使用才能发挥作用,以下是如何使其正常工作的方法。
- Begin by sketching major phases and identifying essential deliverables. Use milestones to mark meaningful achievements and to help everyone share a common view of progress. Identify dependencies clearly: when a task cannot start before another ends, or when tasks must run in parallel. Ensure someone is responsible for updating progress so the chart remains accurate.
首先勾勒出主要阶段并确定关键交付成果。使用里程碑来标记重要的进展,并帮助所有人对进度达成共识。明确区分任务间的依赖关系:例如,一项任务必须在另一项任务完成后才能开始,或者各项任务必须并行执行。确保有人负责更新进度,以保证进度表始终准确。 - Make the chart visually readable. Use shading, softness and contrast to show what is complete versus what is pending. If some tasks are critical to your deadline, highlight them so that delays in these tasks immediately command attention. Choose your audience each time you present the chart. If presenting to leadership, simplify the view. If presenting to the team working the tasks, let them see more detail so they can coordinate effectively.
确保图表清晰易读。运用阴影、柔和度和对比度来区分已完成和待完成的任务。如果某些任务对截止日期至关重要,请突出显示它们,以便这些任务的延误能够立即引起重视。每次展示图表时,都要根据受众选择合适的对象。如果向领导层展示,请简化视图。如果向执行任务的团队成员展示,则应提供更多细节,以便他们能够更有效地协作。 - Whenever possible use tools that allow versioning or baselining. Having an original plan makes divergences visible. When changes in sequence, scope or resources occur, show both what was planned and what the adjusted plan is. That comparison is often one of the most powerful insights you can offer.
尽可能使用支持版本控制或基线管理的工具。一份原始计划能让偏差一目了然。当顺序、范围或资源发生变化时,要同时展示原计划和调整后的计划。这种对比往往能提供最有价值的信息。
Why Gantt Charts Matter in Presentations为什么甘特图在演示文稿中很重要
Section titled “Why Gantt Charts Matter in Presentations为什么甘特图在演示文稿中很重要”When you include a Gantt chart in a presentation the audience tends to trust project plans more. It signals that you have thought not only through what needs to happen but through when and how. It helps reduce follow‑up questions and clarifies allocation of responsibilities. It turns abstract timelines into concrete visuals.
在演示文稿中加入甘特图,能让观众更信任项目计划。这表明你不仅考虑了需要做什么,还考虑了何时以及如何做。它有助于减少后续问题,并明确责任分配。它还能将抽象的时间线转化为具体的视觉呈现。
When you present slide after slide of strategy or objectives without showing how these map into time, tasks and people, you leave room for mismatch. A Gantt chart slots into your presentation as the bridge between strategy and execution. It shows what comes first, what depends on what and what could break things if delayed.
如果你只是一页页地展示战略或目标,却不说明这些战略或目标如何与时间、任务和人员对应起来,就很容易出现脱节。甘特图可以作为战略与执行之间的桥梁,巧妙地融入你的演示文稿中。它清晰地展示了哪些事情优先进行,哪些事情相互依赖,以及哪些事情如果延误会导致哪些问题。
Final Thoughts 最后想说的话
Section titled “Final Thoughts 最后想说的话”Gantt charts do not solve every planning problem but they solve many. They transform invisible assumptions into visible structure. They expose dependency risks. They provide communication clarity. They help you catch delays before they become crises. When you build one with care, keep it current, and align how detailed it should be depending on who sees it, your project gains credibility.
甘特图虽然不能解决所有计划问题,但确实能解决很多。它们将不可见的假设转化为可见的结构,揭示依赖关系风险,提升沟通效率,并帮助你防患于未然,避免延误演变成危机。精心制作甘特图,保持更新,并根据查看者调整详细程度,你的项目就能赢得信任。
Knowing when to show a timeline, when to lead with the conclusion, and how to organize your ideas so they land with impact is a skill in itself. That’s where presentation structure becomes just as important as content.
何时展示时间线,何时以结论开篇,以及如何组织思路才能产生影响力,这本身就是一项技能。正因如此,演示结构与内容同等重要。
If you’re building slide decks that need to do more than just inform, our Presentation Storytelling course is designed to help. It focuses on how top consulting firms like McKinsey and BCG structure their messaging and design presentations that are clear, insightful, and engaging.
如果您制作的幻灯片演示文稿不仅仅需要传递信息,我们的“演示故事讲述”课程正是您需要的。该课程重点讲解麦肯锡和波士顿咨询公司等顶级咨询公司如何构建信息传递框架,以及如何设计清晰、深刻且引人入胜的演示文稿。
Because in the end, even the best Gantt chart only works when it fits into a presentation that tells the right story.
因为归根结底,即使是最好的甘特图,也只有在与能够讲述正确故事的演示文稿相匹配时才能发挥作用。